Thursday, October 29, 2009

Stopping alert floods when branch office connectivity is lost OR simple opsmgr Event Rule and Monitor Creation


We had a problem where we would get alert floods of heartbeat and computer not responding alerts when we lost a network link to a branch site in System Center Operations Manager 2007.  After posting a question on the social groups I was directed to an excellent post by Steve Ross that basically solved my question.  I have extended is solution with a few very minor changes that allowed it to work better for me.  Note that Ross has updated his script a few times and I probably won’t B) so make sure to check his site first.  I will detail my changes and how I set up my alerting below.  Again, my MP-fu is still developing, I should probably put this together in a nicely packaged MP but that will have to come as a future iteration.

After setting up his script, I created a simple Windows Event Reset monitor that watched for event 18041, fired an alert.  The monitor reset on 18040 events but the alert stayed so I could see what had happened.  One problem was that I didn’t have an easy way to see how long the outage was without digging into the logs on the machine running the alerts.  I also had an issue that if more than one branch went down, I didn’t get a second alert.  Not all branches are created equal, if a small office branch went down, I may decide it can wait for a more appropriate time to fix, if a major site branch goes down, I need to know now. 

Remember, this all extends the work done by Steve Ross, (which extends yet others, ain’t teh interwebs grand?).  Go there, get his script if you are trying to suppress alert floods.  Then come back and read through the below to see if it makes sense in your env.  If you just want a rule/monitor walkthrough, well… enjoy… and skip to Items 3 and 4 below.

Update: as of Nov 23, 2012, it looks like the Steve Ross site is no longer responding.  I have put my modified version of his script here.  

Here are the things I did to make it more workable for me.


1.       We have a management server that is dedicated to branch gateway traffic, I am running my script on there as a scheduled task.  We have notifications go out for alerts that are older than 5 minutes so I set this to run every 2 minutes.
2.  I changed the alerting logic slightly.  I wanted to have down events show as Error Events.  I also wanted different branches to show as different event numbers.  I did this by adding the for loop variable (‘i’) to the event number.
I did both by changing this line in the script:

Call oAPI.LogScriptEvent("BranchSiteMonitoring.vbs", badEvt, 0, "Branch " & _
"site router for the " & var3(1) & " computer group is unavailable.  " & _
"Computers in this group should be in maintenance mode currently.")

to

Call oAPI.LogScriptEvent("BranchSiteMonitoring.vbs", badEvt + i, 1, "Branch " & _
"site router for the " & var3(1) & " computer group is unavailable.  " & _
"Computers in this group should be in maintenance mode currently.")

3.       Then I created an Event Collection Rule
a.       Under the Authoring panel -> Rules –> create a rule.
b.      We are going to create a simple NT Event Log Collection rule.  This rule will watch the event log and, whenever on of our specified events happens, it will grab it and put it in the database.  I am not alerting here.  I have a separate alert for that below.  This is just to record the data for posterity’s sake.  Actually, this is to create a view so I can see at a glance, whether we are up or down and where.   Don’t forget to pick a management pack to store this in, all the guidance warns away from using the default MP.  Generally, we put overrides for specific MPs in an MP specific management pack. _SQL_Overrides or similar.  This doesn’t override anything specific so we have a catchall for other types of rules.
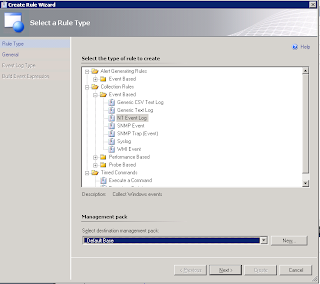


c.       Enter your rule name, category, etc.  I am targeting this at the Availability health of a windows computer.  I am effectively saying that if my branches are not in communication, my gateway server is unhealthy.  I am also setting the rule to disabled.  I will override and enable it on certain machines (the gateway) that I want to watch.


d.      Set your log to ‘Operations Manager’ as this is where the script logs to.


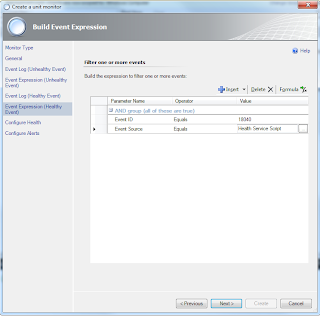
e.      Set your Event source to Health Service Script.  If you are making your own rules, you can get the details from any event in the event logs, see the pic below.  For the Event ID, I wanted to match alerts for any of my branches.  According to the logic we set up earlier, ‘All clear’ events default to 18040.  The script will then loop through the branches and increment the error message, branch1 will be 18041, branch 2 will be 18042, etc.  In order to catch all my branches, I put in the regex ‘1804[0-9]’.  This will match ‘1804’ followed by any single digit.


4.       Next, I created Windows Event Reset Monitor for each branch that I wanted to alert on
a.       Under the Authoring console -> create Monitor

b.      Select Windows Events -> Simple Event Detection -> Windows Event Reset.  Make sure to select the MP you want to save the Monitor to.


c.       Fill in a Name and Description.  I set the monitor target to be Windows Computer and the parent monitor to be availablility.  Note that we do not enable the monitor in this instance.  I am leaving it disabled and I will override it to enable it on certain machines.  This prevents all my machines from wasting cycles on something I only need to watch on one.


d.      Specify ‘Operations Manager’ as the log we are watching.


e.      Enter the Event source and the Event ID of the event we are trying to catch.  These can be gathered from the event itself.  See the highlighted pic below.


f.        For the ‘good’ event, we do the same as above. Specify ‘Operations Manager’ as the log we are watching.


g.       Enter the Event source and the Event ID of the event we are trying to catch.  These can be gathered from the event itself.


h.      We want this monitor to be a critical alert so we set the states accordingly.


i.         I want to generate an alert with a specific Alert name as below.


j.        Hit Create.  Then do this again for each branch (I couldn’t find a way to create monitors in powershell or I would have scripted this.  B)
5.       Now that you have all of your Monitors and your rule created, you will want to enable them for specific computers you want to monitor.  In my case, we have the script running in one place so I only enabled it on one machine. 
a.       Find the rule in the authoring pane. 
b.      Click overrides – Override the rule – for a specific object of class: …


c.       Find your monitor server in the object selector.
d.      Click Enabled and change the value to true.


e.      Now find your monitors in the authoring pane.  Repeat steps b-d for each.
6.       Now you should get alerts when branch sites are down and they should clear when they are up. 
7.       I also created a view to be able to see the events coming in.  From here I can see what the state is now and what, if anything, has been down recently.
a.       In the monitoring pane, right click on your MP folder and select New -> Event View
b.      Specify that you only want events with a specific event number and specifiy that number to include all your ‘All clear’ event and all of your branch events.


c.       Save the view.
8.       Enjoy!

Thursday, October 22, 2009

Fixing McActiveDir.ActiveDirectory in OpsMgr 2007 R2

Hey all,
Just a quick one here.  I didn’t see a straightforward answer around.  When we got:
AD Lost And Found Object Count : The script 'AD Lost And Found Object Count' failed to create object 'McActiveDir.ActiveDirectory'. This is an unexpected error.
The error returned was 'ActiveX component can't create object' (0x1AD)


We needed to install oomads.msi from the OpsMgr cd on each dc.  I cheated and ran the install through the following for loop:
 for %i in (dc1 dc2 dc3) do psexec \\%i -u DOM\USER -p "PASS” msiexec /I  "\\fileserv\PATH\OOMADs.msi" /qb

Tuesday, October 13, 2009

Get authoritative DNS entry in Powershell

This is a small script I worked up to find the authoritative NS for a host and ask it for the IP.  It will take a host to check, do a whois from the www.trynt.com web service and ask each of the authoritative name servers for an IP. 

For my purposes, I didn’t need to worry about foreign hostnames (bbc.co.uk) so I cheated a bit on splitting up the host from domain name.  I am just taking the last two strings (split by “.”) as the domain name.  so host.net.company.com and www.company.com will do a whois for company.com (correct) but www.bbc.co.uk will do a whois for co.uk (incorrect).

This relies on my library for the out-log function.  This was detailed here.  The line below . ./ejlib.ps1 should be the path to wherever you saved your out-log function.  If you don't want to use the out-log function, just comment out all the out-log lines, they are only for logging.  (ie put an # in front of each line that begins w/ out-log (or just remove out-log and any number after the string and it will print to the console).


To use it just pass -host "host.company.com" to the function or script.  If you save the below as get-authdns.ps1 in the local directory you would call:
./get-authdns.ps1 -host "www.microsoft.com"
optionally add "-v 3" to see debugging messages.

#get-authDNS
#does a whois to get a auth DNS server and gets the ip address for that host.
param(
      $HostToCheck,
      $verbosity = 0
)

#load library
. ./ejlib.ps1
out-log "Libraries Loaded"

#pull off hostname for whois.  does not work w/ foreign (.co.uk, type) domains
$arrHostToCheck = $hostToCheck.split(".")
$strDomainForWhois = "$($arrHostToCheck[$arrHostToCheck.count-2]).$($arrHostToCheck[$arrHostToCheck.count-1])"

#crediting TryNT for their whois web gateway <a href="http://www.trynt.com/" title="TRYNT Web Services">TRYNT Web Services</a> Powered
$uri="http://www.trynt.com/whois-api/v1/?h=" + $strDomainForWhois + "&f=1"
out-log "Contacting Whois.  URL: $uri"
$resp=[xml](New-Object -TypeName System.Net.WebClient).Downloadstring($uri)

out-log "Selecting XML from WHOIS" 2
$colNSIPs = $resp.SelectNodes("descendant::Trynt/Whois/regrinfo/domain/name-server/ip")

#we will iterate through our collection of NS IPs until we get an answer.

if (-not ($colNSIPs.item(0).data.count -gt 1)) { # we didn't get a response from TryNT
      out-log "ERROR: No response from WHOIS"  0
      exit
} else {
      out-log "We received a legible response from WHOIS containing $($colNSIPs.item(0).data.Count) IPs"
      foreach ($ip in $colNSIPs.item(0).data) { # try to get an IP
            out-log "Checking NS: $IP" 2
            $strIP = $(& "c:\windows\system32\nslookup" $HostToCheck $IP)[4].Split()[2]
            #check that we did find an IP
            if ($strIP -match ("\d{1,3}\.\d{1,3}\.\d{1,3}\.\d{1,3}")) {
                  out-log "Found $strIP for $HostToCheck from NS: $ip"
                  break
            }
      }
     
}

return $strIP
           

Monday, September 14, 2009

I hate computers OR unexpected results running powershell dos commands

You would think running a dos command from powershell would be simple right? I was trying to assemble a fairly complex command, run it and parse the results. (Trying to run TFPT from the Visual Studio powertools. This in it self was a work around so I could load 32 bit libraries in a x64 shell).

The command was pretty complex so I didn't realize where my problem truely was for some time after trying various invoke-expression/item, "&" running, cmd /c, etc.

I could not figure out why my command would run correct at the dos prompt but not work when running through cmd /c. Apparently, there is a VERY important little space that I wouldn't have thought would matter. Silly me.

$var = cmd /c " `"$TFPT`" workitem ..."
is not the same as
$var = cmd /c "`"$TFPT`" workitem ..."

It seems that the powershell processor needs that space for it to correctly pass the line to the cmd shell. I don't know why.

Hopefully this will help somebody out.

Wednesday, September 09, 2009

Force a powershell script to run in x86 process with arguments

I needed to instantiate TFS variables but they seem to only be available in 32 bit run space.  I found a few great work ups for the vcvars here:

http://www.agileprogrammer.com/dotnetguy/archive/2007/11/22/23853.aspx

http://www.tavaresstudios.com/Blog/post/The-last-vsvars32ps1-Ill-ever-need.aspx


I will note that in my travels I found Jaredpar and added most of these functions to my library to test for x64/x86 program space.


I ended up going w/ the last one but I then needed to make sure my script was running in x86 space.  This would be automated out of SCOM so I couldn’t really just tell my users to run in in the right version (besides, what kind of solution is that?).  Some of the tasks would be run from x86 space and some from x64. 


Vivek Sharma had a good write up that put me on the right path here: http://www.viveksharma.com/TECHLOG/archive/2008/12/03/running-scripts-that-only-work-under-32bit-cleanly-in-64bit.aspx.


I had two problems.  First off, the solution doesn’t work.  -file didn’t work, I assume this is a powershell 2 change.  Neither did –executionpolicy.  ( I didn’t check if either were around in v1 but I did check my solution against a v1 install).  I also needed the arguments so after a bit of banging around, this is what I came up with.


#force this to run in 32 bit

if ($env:Processor_Architecture -ne "x86")

{

      write-warning "Running x86 PowerShell..."

            &"$env:WINDIR\syswow64\windowspowershell\v1.0\powershell.exe" -NonInteractive -NoProfile $myInvocation.Line

      exit

}


I created the following and called it test-Launch32Bit.ps1 to show usage.  Run with PS> test-Launch32Bit.ps1 –arg1 argument1 –arg2 aarrrrgghhh

"My Script Line: $($myinvocation.line)"

"My Proc Architecture: $env:Processor_Architecture"

"List arguments below:"

"##############"

$args

"##############"


#force this to run in 32 bit

if ($env:Processor_Architecture -ne "x86")

{

      write-warning "Running x86 PowerShell..."

            &"$env:windir\syswow64\windowspowershell\v1.0\powershell.exe" -noninteractive -noprofile $myinvocation.Line

      exit

}


Note that you will need to set your execution policy beforehand for each x86 and x64 registry trees.  They are not the same setting!  I am sure this stems from the invisible x86 registry redirection.  Easiest thing is to just run each yourself and set-executionpolicy to whatever your env demands. 

Wednesday, July 08, 2009

opsMgr Web Console Mobile ReportViewer error

I would have expected this to be up somewhere already but I couldn’t find it when I wanted to get my mobile site working.  I went the URL http://webconsoleURL:51908/mobile.  But I was greeted w/ the following error:

Configuration Error

Description: An error occurred during the processing of a configuration file required to service this request. Please review the specific error details below and modify your configuration file appropriately.

Parser Error Message: Could not load file or assembly 'Microsoft.ReportViewer.WebForms, Version=8.0.0.0, Culture=neutral, PublicKeyToken=b03f5f7f11d50a3a' or one of its dependencies. The system cannot find the file specified.

Source Error:


Line 23:     <httpHandlers>

Line 24:       <add path="ChartAxd.axd" verb="*" type="Dundas.Charting.WebControl.ChartHttpHandler" validate="false" />

Line 25:       <add verb="*" path="Reserved.ReportViewerWebControl.axd" type="Microsoft.Reporting.WebForms.HttpHandler, Microsoft.ReportViewer.WebForms, Version=8.0.0.0, Culture=neutral, PublicKeyToken=b03f5f7f11d50a3a" />

Line 26:     </httpHandlers>

Line 27:     <httpModules>


Source File: C:\Program Files\System Center Operations Manager 2007\Web Console\web.config    Line: 25

Assembly Load Trace: The following information can be helpful to determine why the assembly 'Microsoft.ReportViewer.WebForms, Version=8.0.0.0, Culture=neutral, PublicKeyToken=b03f5f7f11d50a3a' could not be loaded.


After a bit of searching, and turning on tracing, I found it was looking in the <WEB CONSOLE ROOT>\mobile\bin directory for the dlls Microsoft.ReportViewer.Common.dll and Microsoft.ReportViewer.WebForms.dll but they weren’t there.  I copied them from <WEB CONSOLE ROOT>\bin to <WEB CONSOLE ROOT>\mobile\bin and reloaded the page.  Voila!

Thursday, July 02, 2009

opsmgr maintenance mode reporting update

Figures… roughly 15 seconds after posting OpsMgr Maintenance Mode report, I found a better way to get my collection of “inMaintenanceMode” objects.  I wouldn’t call this script ‘light’ by any means but at least I query more directly.


param (

      $RootMS,

      $filename

      )


#Initializing the Ops Mgr 2007 Powershell provider

add-pssnapin "Microsoft.EnterpriseManagement.OperationsManager.Client" -ErrorVariable errSnapin;

set-location "OperationsManagerMonitoring::" -ErrorVariable errSnapin;

new-managementGroupConnection -ConnectionString:$rootMS -ErrorVariable errSnapin;

set-location $rootMS -ErrorVariable errSnapin;


#create my array for output


$colOut = New-Object System.Collections.ArrayList


#set query criteria and get collection of objects in Maintenance

$criteria = new-object Microsoft.EnterpriseManagement.Monitoring.MonitoringObjectGenericCriteria("InMaintenanceMode=1")

$objectsInMM = (Get-ManagementGroupConnection).ManagementGroup.GetPartialMonitoringObjects($criteria)


#loop to populate the array

foreach ($mm in $objectsInMM) {

      $MWin = $mm.getmaintenancewindow()


      #create an object to hold our variables

      $out = "" | select Name,Path,DisplayName,FullName,StartTime,ScheduledEndTime, Reason, Comments, User, LastModified

      $out.Name = $mm.name

      $out.Path = $mm.Path

      $out.DisplayName = $mm.Displayname

      $out.FullName = $mm.Fullname

      $out.Starttime = $Mwin.Starttime

      $out.ScheduledEndTime = $MWin.ScheduledEndTime

      $out.Reason = $MWin.Reason

      $out.Comments = $MWin.Comments

      $out.User = $Mwin.User

      $out.LastModified = $Mwin.LastModified


      #add to our array

      $colOut.Add($out)

}


#change providers for file work

C:

#spit to csv

$colOut | Export-Csv $filename

Check this out!

Check this out, my mother has started a new blog, Intersections over at Astrology for Business. Please take a second to check it out.
http://astro4business.com/

OpsMgr Maintenance Mode report

Updated version: http://cornasdf.blogspot.com/2009/07/opsmgr-maintenance-mode-reporting.html

I needed to report on all items in maintenance mode.  On the web were entries like this one, but that was focused on the computer and agent level, whereas we had lower level objects that were in maintenance mode.  I ended up writing this script.  I still have cleanup to do in my env to make it operational but the basic logic is here.


One thing to note is that each of these items seems to come up 6 or 7 times.  Not sure why at this point but the report is good enough for our purposes and I have other things to do.  B)


Enjoy!


#give me all the objects we are monitoring

$colAll = get-monitoringclass | get-monitoringobject


#select out only the ones that are in maintenance mode

$colMM = $colAll | where {$_.inmaintenancemode -eq $true}


#create my array for output

$colOut = New-Object System.Collections.ArrayList


#loop to populate the array

foreach ($mm in $colMM) {

      $MWin = $mm | get-maintenancewindow


      #create an object to hold our variables

      $out = "" | select FullName,UniquePathName,StartTime,ScheduledEndTime, Reason, Comments, User, LastModified

      $out.FullName = $mm.Fullname

      $out.UniquepathName = $mm.UniquePathName

      $out.Starttime = $Mwin.Starttime

      $out.ScheduledEndTime = $MWin.ScheduledEndTime

      $out.Reason = $MWin.Reason

      $out.Comments = $MWin.Comments

      $out.User = $Mwin.User

      $out.LastModified = $Mwin.LastModified


      #add to our array

      $colOut.Add($out)

}


#spit to csv

$colOut | Export-Csv C:\MaintenanceModeReport.csv


analytics